When every indicator is green, the most important question is: who decided the colour?
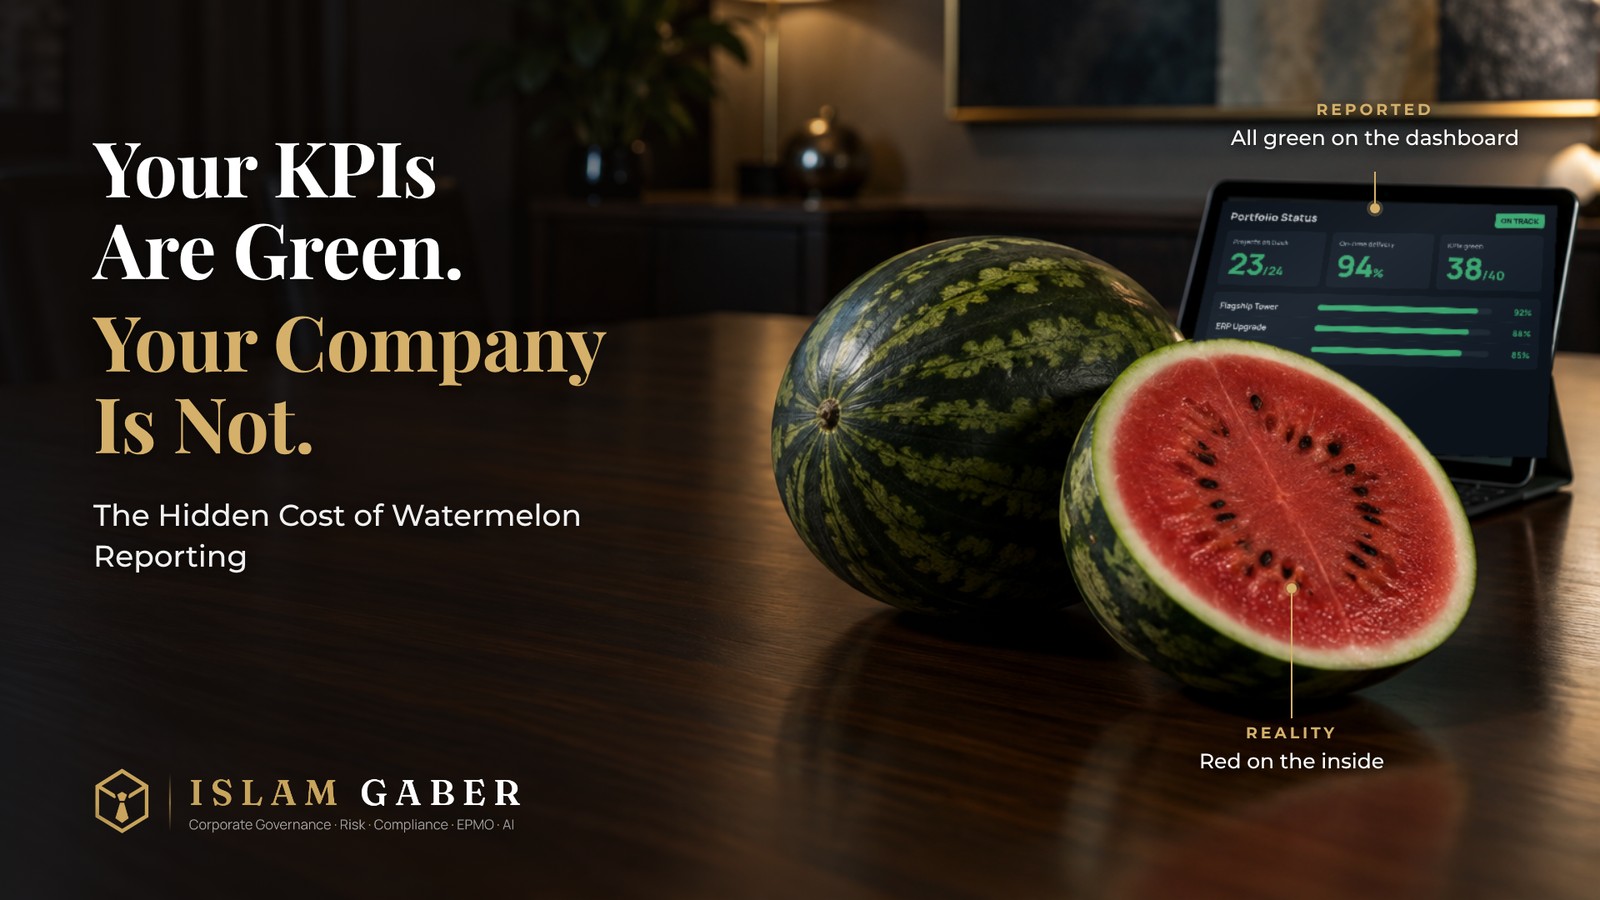
The quarterly board meeting runs exactly to schedule. The portfolio dashboard shows forty indicators, and thirty-eight of them are green. Twenty-three of twenty-four projects are on track. Budget utilisation is healthy. The chairman thanks management, and the meeting closes early.
Four months later, the company's largest project is declared nine months late and significantly over budget. The cash forecast is rebuilt from scratch. Financing has to be renegotiated. And the same executives who presented green dashboards all year explain that the problems "emerged suddenly".
They did not. The problems were visible for months — on site, in the schedule, in the supplier invoices. They were simply not visible in the reports that reached the top.
Project managers have a name for this: watermelon reporting — green on the outside, red on the inside. It is one of the most expensive governance failures a company can have, because it does more than hide a problem. It takes away the one thing the board needs to fix it: time.
The Project Failed Slowly. The Report Failed Suddenly.
Consider a pattern that repeats across many organisations. A major project starts well. By the third month, the work actually completed begins to fall behind plan. The gap is small, so the status stays green. By the fifth month, the gap is wider, but the team still expects to recover, so the status stays green. By the seventh month, recovery is no longer realistic — but nobody wants to be the first to say it.
Then, in a single reporting cycle, the status jumps from green to red.
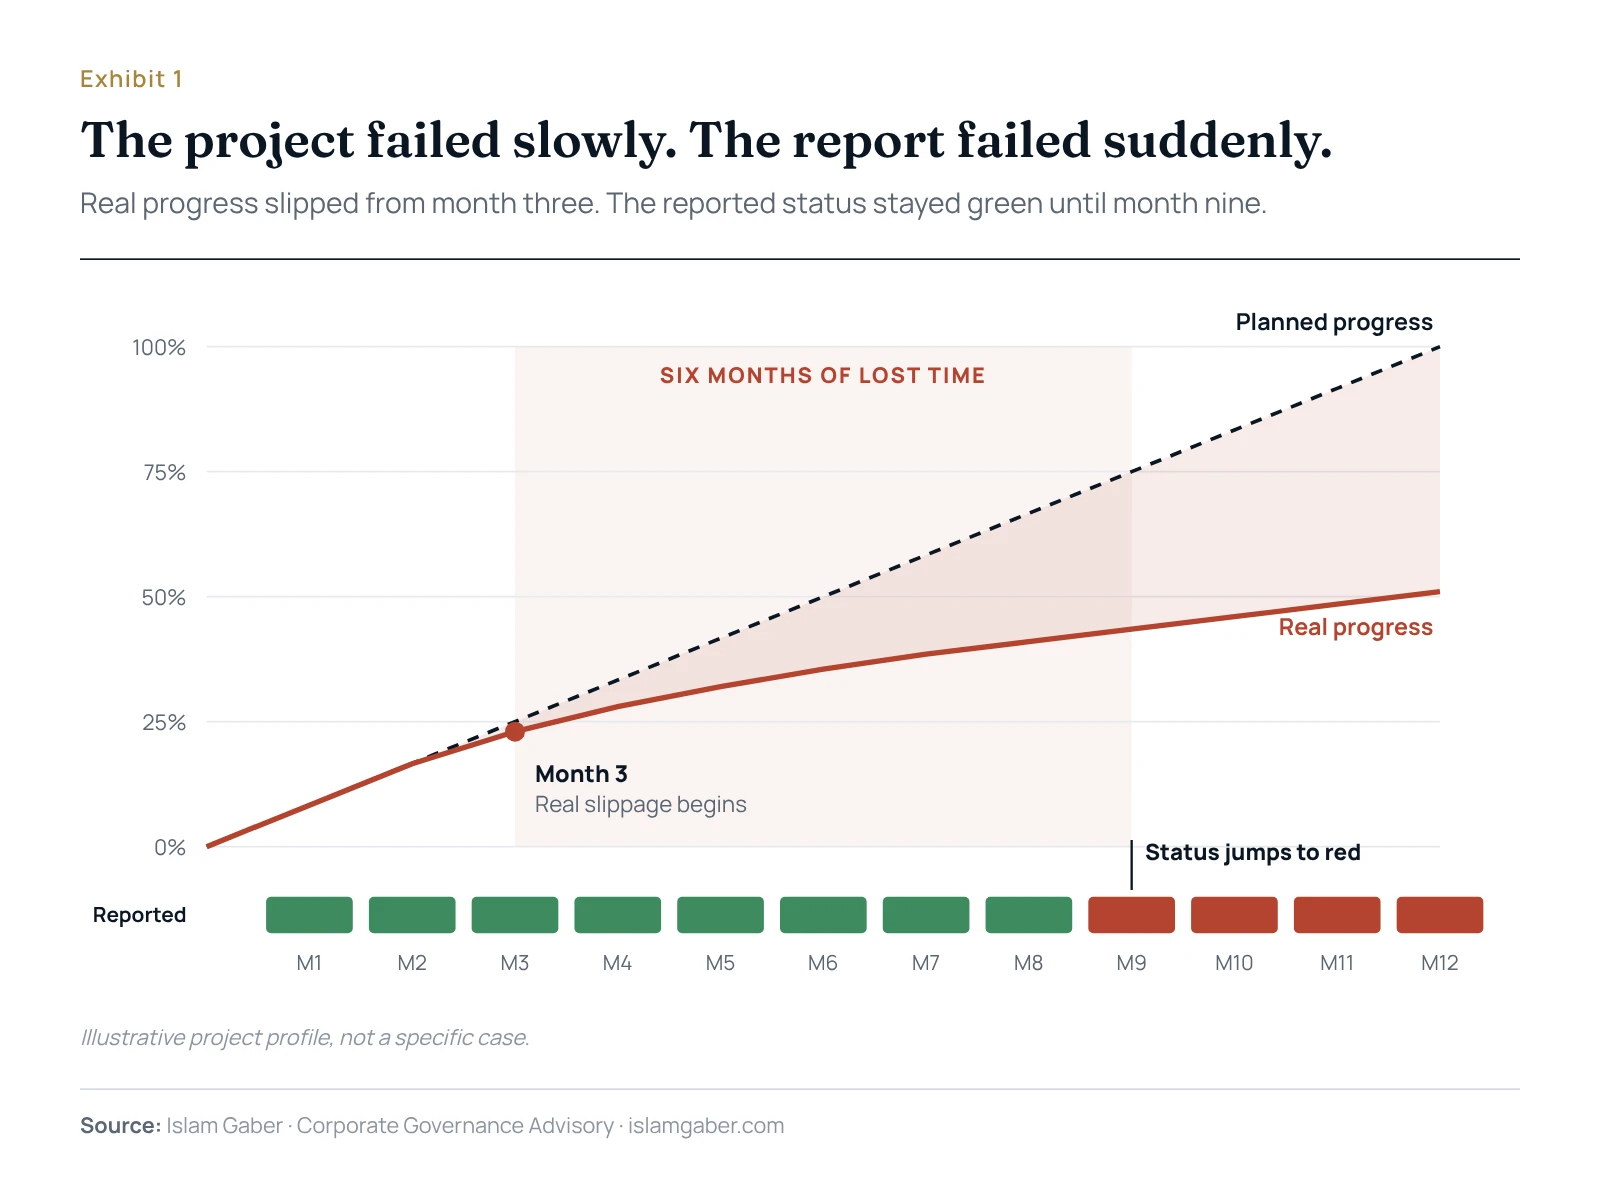
The project did not fail in month nine. It failed slowly, from month three. Month nine was simply the moment the report caught up with reality. Every month in between was a month in which the board could have intervened — re-scoped, re-financed, replaced a contractor, or stopped — and did not, because it did not know.
That is the real cost of a green report that is not true: not the bad news itself, but the six months of options that disappeared before anyone heard it.
The Average That Lied
Watermelon reporting does not only happen inside single projects. It is even more common at portfolio level, where averages do the hiding.
Take an illustrative portfolio of twelve projects worth SAR 2.5 billion in total. Eleven of them are small and medium projects, worth SAR 1.5 billion together, and all of them are genuinely on track. The twelfth is the flagship: SAR 1 billion on its own, and in serious difficulty.
The dashboard reports "92% of projects on track". It is accurate. It is also deeply misleading.
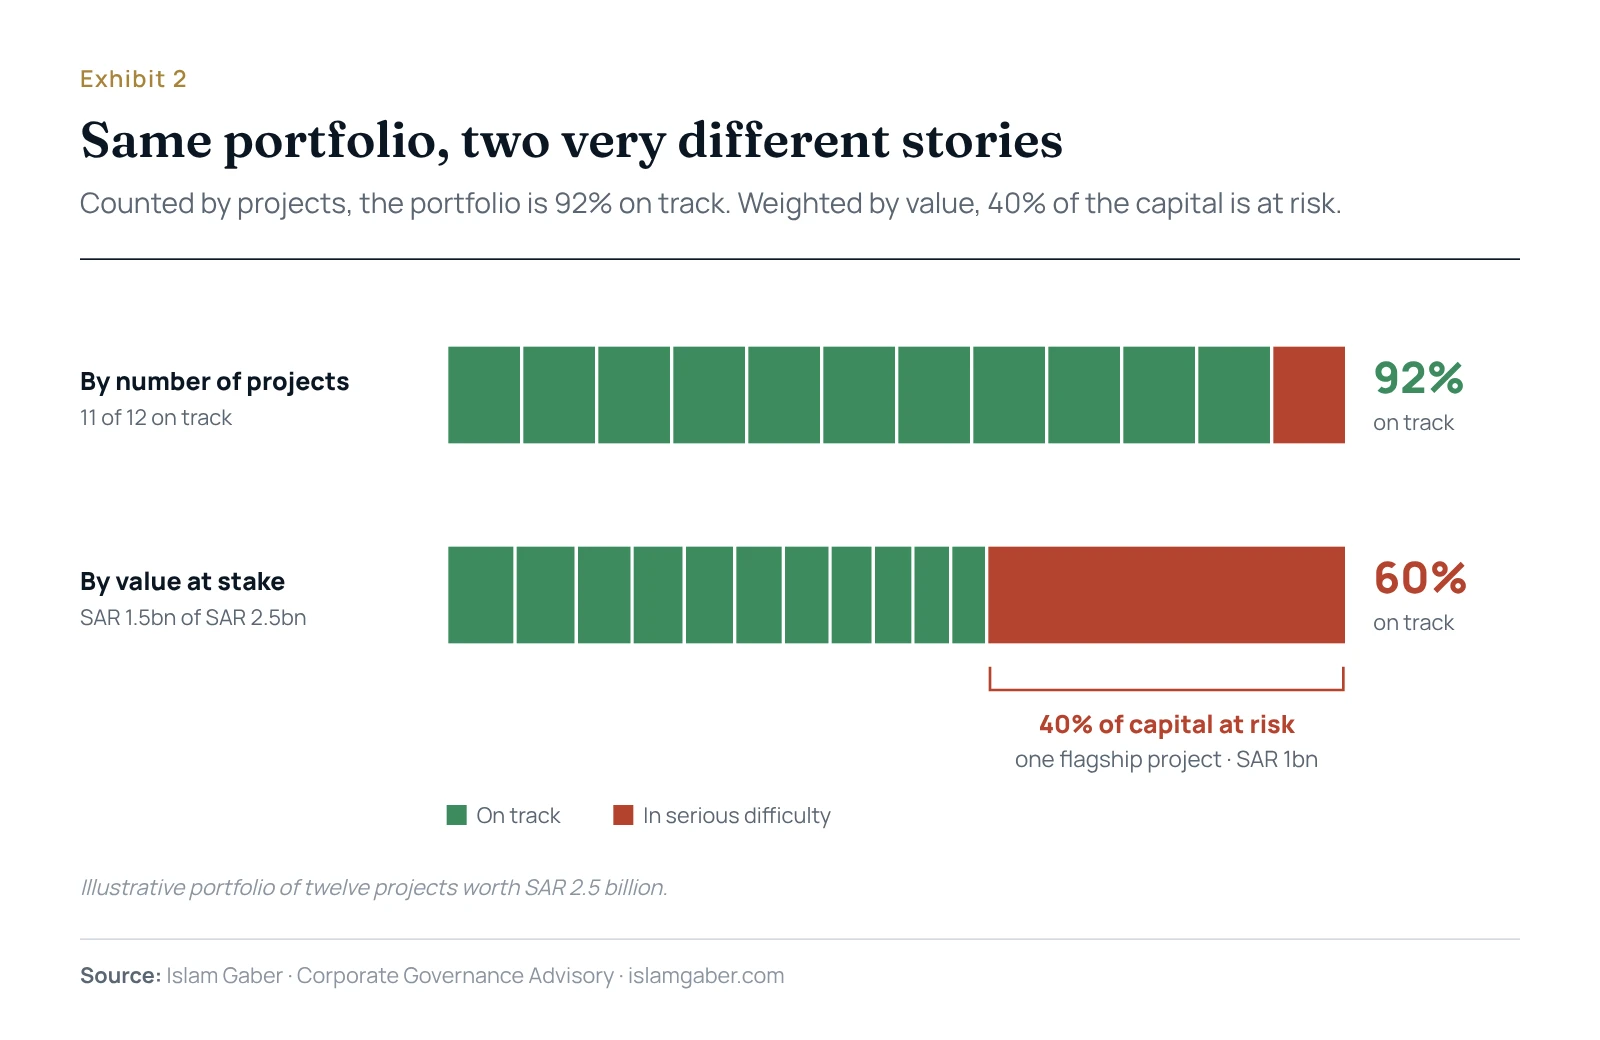
Measured by value, only 60% of the portfolio is on track, and 40% of the company's capital is at risk in a single project. The board saw one number. The business was living the other.
The lesson is simple and widely ignored: a portfolio KPI must be weighted by what is at stake, not by how many items are being counted. And the few projects that carry most of the value should never be hidden inside an average. They should be reported individually, every time.
Why Reports Stay Green
Watermelon reporting is rarely dishonesty. It is almost always a reporting system that makes green the easiest answer. Seven causes appear again and again.
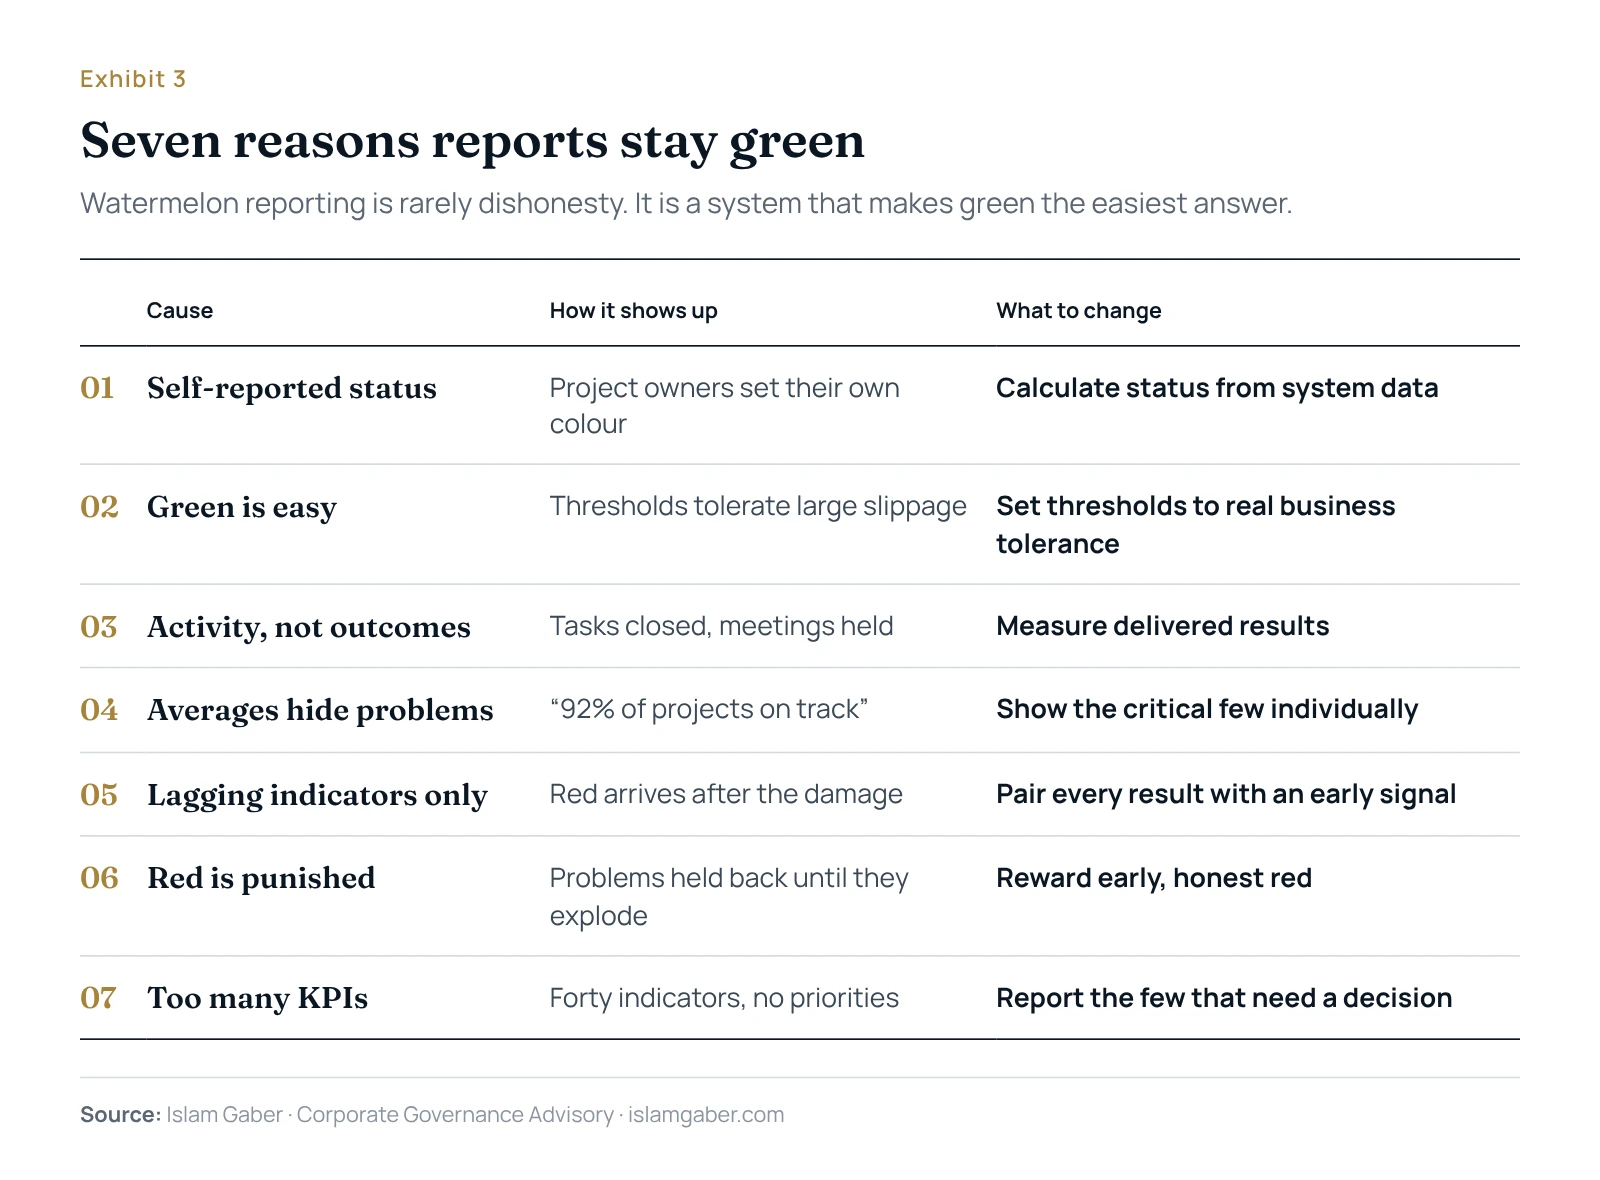
Three of them do most of the damage.
The people being measured choose the colour. When project managers set their own status, optimism is built into the system. Nobody is lying; everyone simply believes they can recover. Multiply that belief across twenty projects, and the dashboard becomes a collection of hopes rather than a picture of reality.
Thresholds are designed to keep things green. If "green" allows a 15% schedule slippage and "amber" starts only after that, most projects will report green until they are already in serious trouble. The thresholds were set to make the dashboard comfortable, not to protect the business.
Red is punished. In many organisations, the first manager to report a problem is the one who gets questioned, blamed or embarrassed in the meeting. People learn quickly. They wait — until the problem can no longer be hidden, by which time it is far more expensive to solve.
The Three Tests of a Real Green
The answer is not more indicators or a better-designed dashboard. It is a discipline: before any green is accepted at management or board level, it must pass three tests.
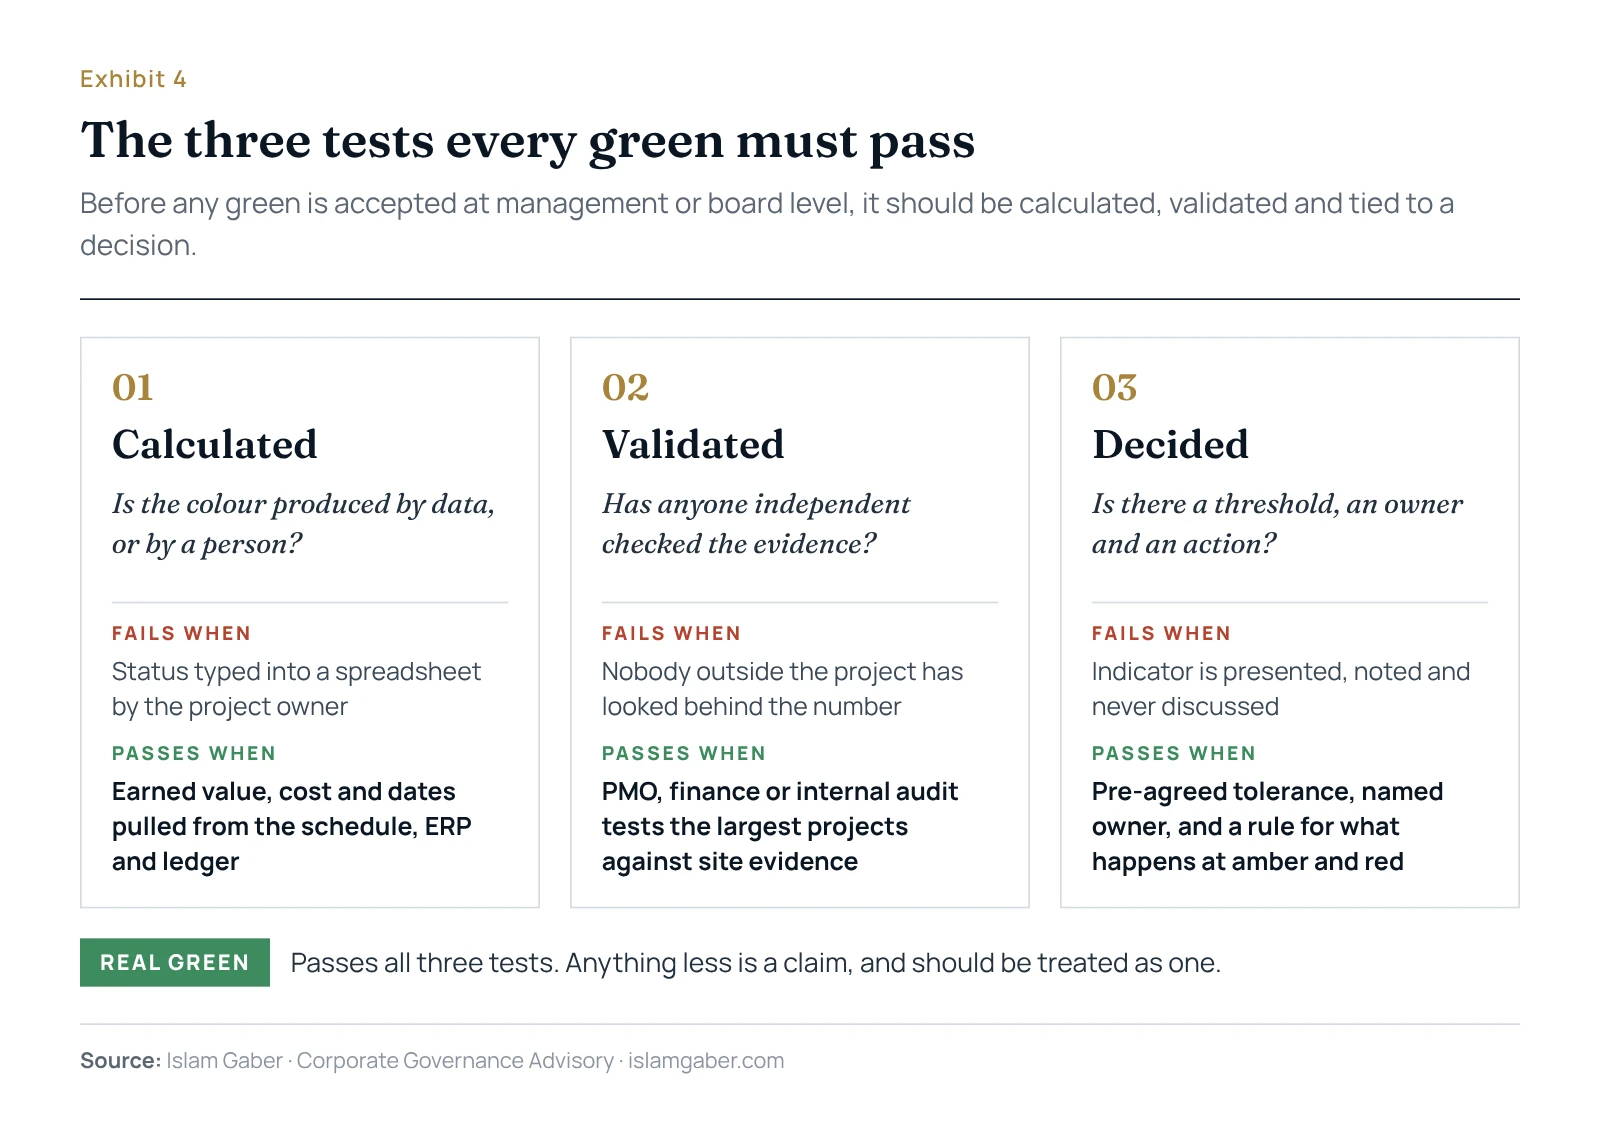
1. Calculated — is the colour produced by data, or by a person? A real green is calculated from source systems: the project schedule, the ERP, the finance ledger. Earned value against plan, actual cost against budget, days from request to delivery. If someone types "on track" into a spreadsheet, it is an opinion, not a measurement.
2. Validated — has anyone independent checked the evidence? Self-reported status should be tested. The PMO, finance or internal audit should periodically verify that what is reported matches what exists — the site, the signed variations, the unpaid invoices — starting with the largest and riskiest projects.
3. Decided — is there a threshold, an owner and an action? Every indicator in front of the board should have a pre-agreed tolerance, a named owner, and a clear rule for what happens when it changes colour. An indicator that never leads to a decision is decoration.
A green that passes all three tests is a real green. A green that fails any of them is a claim, and it should be treated as one.
What the Board Pack Should Look Like
The difference between a comfortable dashboard and a useful one is not design. It is purpose.
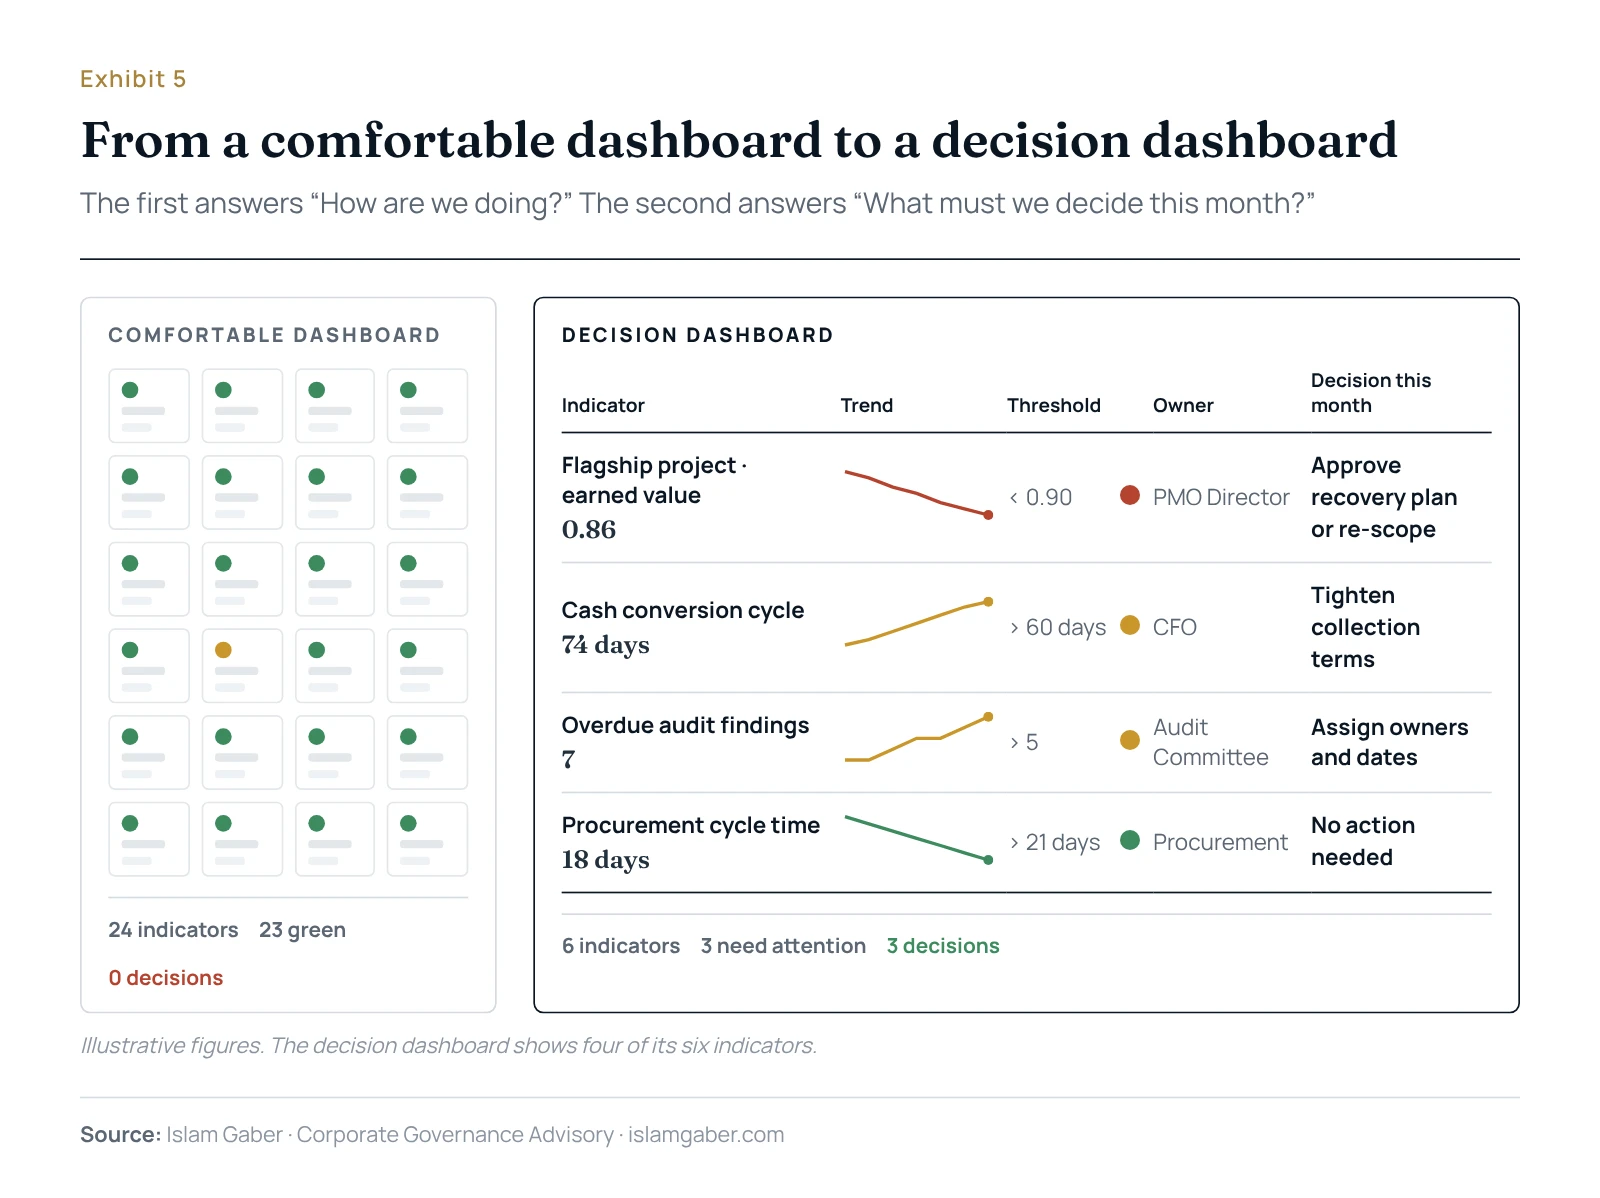
A comfortable dashboard answers the question "How are we doing?" and invites reassurance. A decision dashboard answers the question "What must we decide this month?" and invites action. It shows fewer indicators, each with a trend rather than a snapshot, an honest threshold, a named owner and the decision required. Boards that switch from the first to the second usually find that their meetings become shorter on presentations and longer on decisions — which is exactly the point.
A 90-Day Plan to Make Your Reporting Honest
None of this requires a new system or a large programme. It requires deliberate choices, made in sequence.
- Days 1–30: Cut and define. Reduce the board dashboard to the ten indicators that genuinely drive decisions. For each one, write down the data source, the owner, and the thresholds for amber and red — based on the company's real tolerance, not on comfort.
- Days 31–60: Calculate and test. Move those ten indicators from manual input to system calculation wherever possible. Then ask an independent function to validate the reported status of the five largest projects against the evidence on the ground.
- Days 61–90: Change the conversation. Redesign the board pack around decisions. Report the critical few projects individually and weight portfolio indicators by value. And make one rule explicit in the meeting itself: a problem reported early is good news, and a problem hidden until it explodes is a performance issue.
Five Questions to Ask When the Dashboard Is All Green
- "Which of these numbers are calculated by a system, and which are typed in by the person responsible?"
- "If we weighted this indicator by value instead of by count, would it still be green?"
- "When was the reported status of our largest project last checked by someone independent?"
- "What is the threshold that turns this indicator red — and who agreed it?"
- "What was the last problem we heard about from outside — a customer, a bank, an auditor — before we saw it in our own reports?"
If the answers are vague, the dashboard is not telling you the truth. It is telling you what someone hopes is true.
Measuring It
The RASEKH™ Governance Index assesses reporting and decision-making as governance domains in their own right. Across 15 domains and up to 152 indicators, every score is backed by named evidence, showing owners whether the information reaching the board is calculated, validated and acted on — or simply presented.
The Bottom Line
A green dashboard is not a sign of control. It is a claim. Governance is the discipline of testing that claim before reality tests it for you — because in every company, the most expensive red is the one you see last.